프로그래밍/웹 개발
[chart.js] x축 날짜 데이터 형식 설정 (date)
제이콥J
2022. 1. 19. 16:19
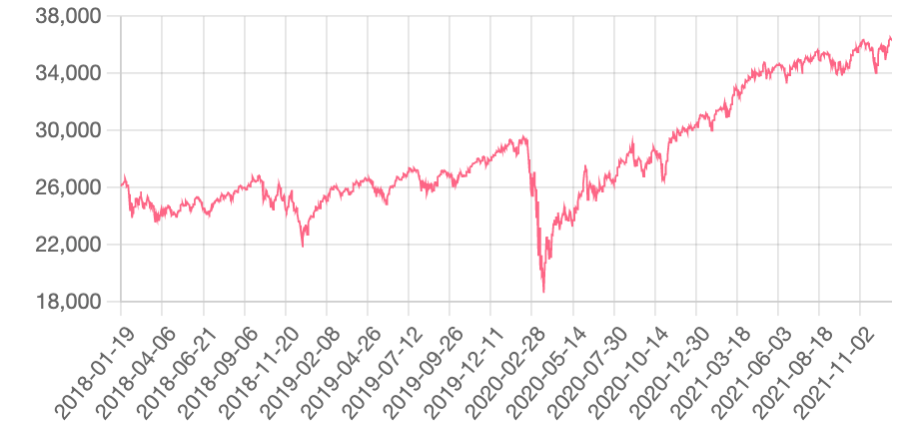
YYYY-DD-MM 형식의 날짜 데이터를 차트의 x축에 표시하면 아래 사진과 같이 깔끔하지 않습니다.
여기서는 chart.js의 문법을 이용해 날짜 데이터 형식을 바꾸는 방법을 포스팅했습니다.
추가 라이브러리
chart.js의 추가 라이브러리인 date-fns adapter가 필요합니다.
npm에서 설치하거나, script 태그에서 CDN 링크를 사용하시면 됩니다.
저는 index.html 파일에 CDN 링크를 입력했습니다.
chart.js 라이브러리 : https://github.com/chartjs/awesome#adapters
date-fns adapter : https://github.com/chartjs/chartjs-adapter-date-fns
# npm 설치 명령어
npm install date-fns chartjs-adapter-date-fns --save
// import 문법
import { Chart } from 'chart.js';
import 'chartjs-adapter-date-fns';
// CDN 링크

<script src="https://cdn.jsdelivr.net/npm/chart.js/dist/chart.min.js"></script>
<script src="https://cdn.jsdelivr.net/npm/chartjs-adapter-date-fns/dist/chartjs-adapter-date-fns.bundle.min.js"></script>
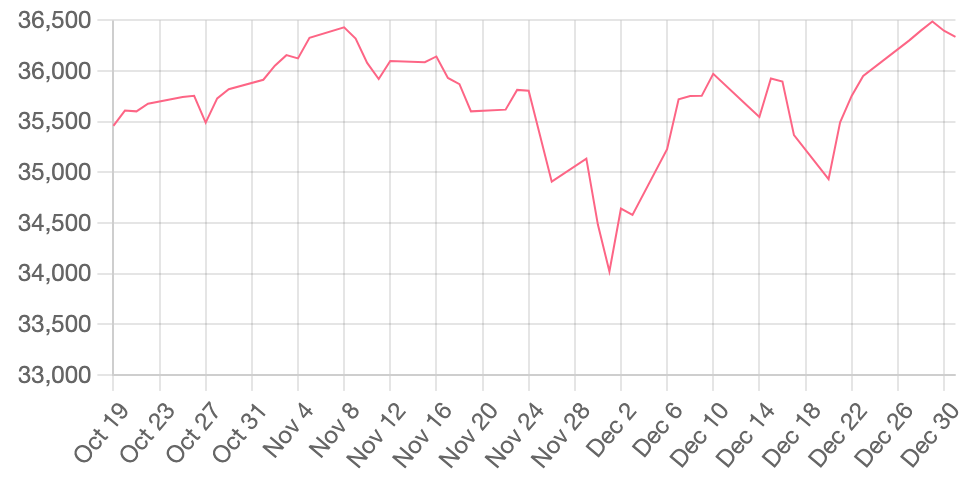
일(day) 단위까지 표시
const ctx = canvasEle.getContext('2d');
const myChart = new Chart(ctx, {
  type: 'line',
  data: {
    // 생략
  },
  options: {
    scales: {
      x: {
        type: 'time',
        time: {
          unit: 'day'
        }
      }
    },
  }
});
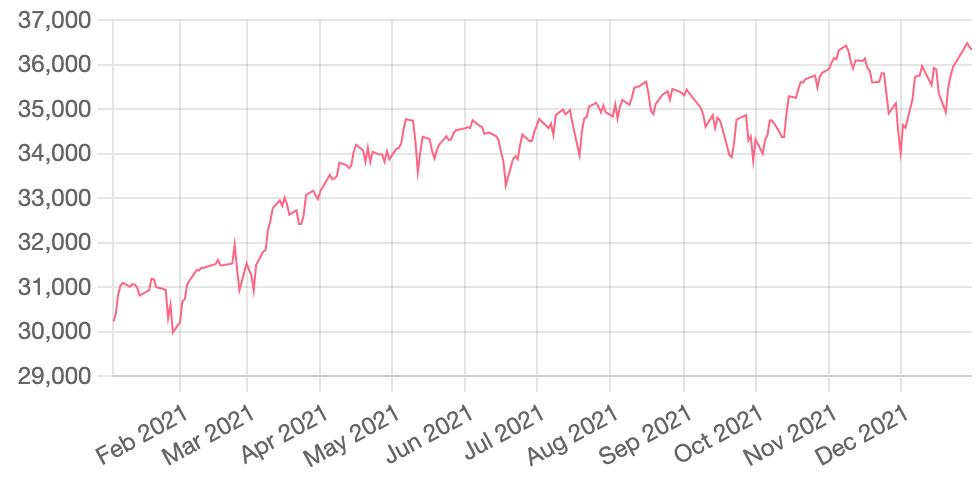
월(month) 단위까지 데이터 표시
const ctx = canvasEle.getContext('2d');
const myChart = new Chart(ctx, {
  type: 'line',
  data: {
    // 생략
  },
  options: {
    scales: {
      x: {
        type: 'time',
        time: {
          unit: 'month'
        }
      }
    },
  }
});
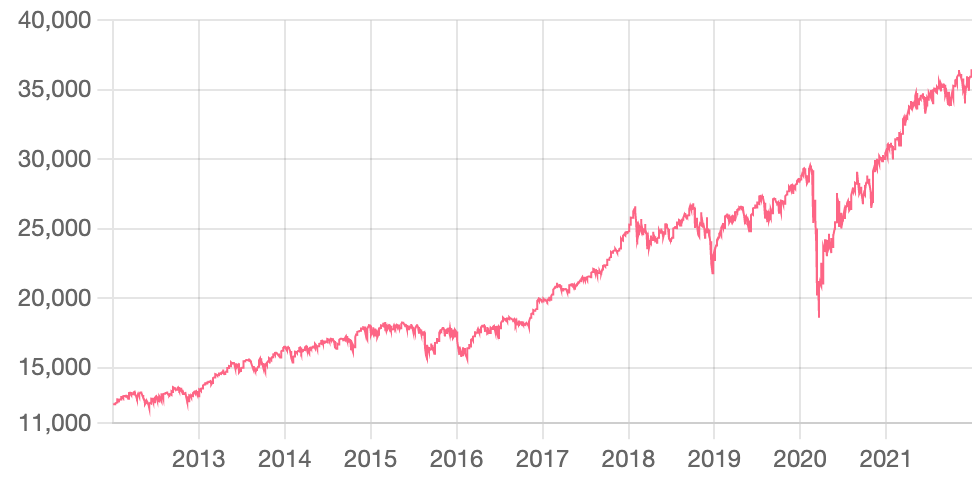
연(year) 단위 데이터 표시
const ctx = canvasEle.getContext('2d');
const myChart = new Chart(ctx, {
  type: 'line',
  data: {
    // 생략
  },
  options: {
    scales: {
      x: {
        type: 'time',
        time: {
          unit: 'year'
        }
      }
    },
  }
});
반응형